 In 2017, we were again reminded of the importance of following an investment approach based on discipline and diversification vs. prediction and timing. As we gear up for the new year, we can look at several examples during 2017 that provide perspective on what guidance investors may want to follow, or not follow, in order to achieve the long-term return the capital markets offer.
Nine Experts
Each January, a well-known financial publication invites a group of experienced investment professionals to New York for a lengthy roundtable discussion of the investment outlook for the year ahead. The nine panelists have spent their careers studying companies and poring over economic statistics to find the most rewarding investment opportunities around the globe.
Ahead of 2017, the authors of the publication’s report were struck by the “remarkably cohesive consensus” among the members of the group, who often find much to disagree about. Not one pro expressed strong enthusiasm for US stocks in the year ahead, two expected returns to be negative for the year, and the most optimistic forecast was for a total return of 7%. They also found little to like in global markets, citing “gigantic geopolitical issues,” including a Chinese “debt bubble” and a “crisis” in the Italian banking system.
The excerpts below summarizing the panel’s outlook presented a less than optimistic view of the year ahead in January 2017.
“This could be the year when the movie runs backwards: Inflation awakens. Bond yields reboot. Stocks stumble. Active management rules. And we haven’t even touched on the coming regime change in Washington.”1 The outcome of these predictions: Zero-for-four, although some might point out that at least they got the direction right regarding the inflation rate.
- Inflation barely budged, moving to 2.17% for the January–November 2017 period, up from 2.07% for the year in 2016.2
- The yield on the 10-year US Treasury note did not move up but instead slipped from 2.45% to 2.40%.
- Stocks moved broadly higher around the world, in some cases dramatically. Twenty out of 47 countries tracked by MSCI achieved total returns in excess of 30%.3
- According to Morningstar, the average large blend mutual fund underperformed the S&P 500 Index by 1.39 percentage points, and the average small company fund underperformed the S&P 600 Index by 1.35 percentage points.
The above-mentioned panel was no aberration. Among 15 prominent investment strategists polled by USA TODAY, the average prediction for US stocks for 2017 was 4.4%, while the most optimistic was 10.4%.4 Expert or not, there is little evidence that accurate predictions about future events, as well as how the market will react to those events, can be achieved on a consistent basis.
Four Surprises
- What do you get when you combine a tumultuous year for a new US president and divisive political trends in many global markets? Answer: a new record. For the first time since 1897, the total return for the US stock market (the CRSP 1-10 Index and, prior to 1926, the Dow Jones Industrial Average) was positive in every single month of the year. During the year, a great deal of media coverage was focused on markets at all-time highs, and some investors braced themselves for a sharp drop in stock prices. Not only did the much anticipated “correction” never occur, financial markets remained remarkably calm. Out of 254 trading days in 2017, the total return of the S&P 500 Index rose or fell over 1% only eight times. By comparison, in a more rambunctious year such as 1999, it did so 92 times.5
- North Korea issued threats of a nuclear missile strike throughout the year and boasted that even mainland US cities were vulnerable to its newest warheads. Next-door neighbor South Korea would seem to have the most to lose if such a catastrophe occurred, but Korean stocks were among the top performers in 2017, with a total return of 29.5% in local currency and 46.0% in US dollar terms.6
- To many experienced researchers, Chinese stocks appeared alarmingly vulnerable. A gloomy November 2016 article7 warned that “China’s debt addiction could lead to a financial crisis.” In the article, a prominent Wall Street strategist observed: “It’s scary that China seems to be continuing its debt binge to achieve its unrealistic growth targets.” And a global fund manager noted: “We are the most underweight China we have been since launching the fund five years ago.” The outcome: China was the third best-performing stock market in 2017 with a total return of 51.6% in local currency and 50.7% in US dollar terms.8
- The seven-year string of increasing US auto sales finally ended in 2017. Domestic sales fell 1.0% at Ford Motor, 1.3% at General Motors, and 10.7% at Fiat Chrysler.9 Anticipating the sales slump, a Wall Street Journal columnist warned investors in January 2017 to avoid the stocks.10 Good advice? Ford Motor had a total return of 8.7%, which was in fact below the 21.8% return of the S&P 500 Index. However, General Motors returned 22.5%, and Fiat Chrysler’s total return came in at an impressive 96.3%, even with more than a 10% drop in sales.11
While some of these examples may seem counterintuitive, the above “surprises” from 2017 reinforce the challenge of drawing a direct link between positive or negative events in the world and positive or negative returns in the stock market.
The Million Dollar Bet
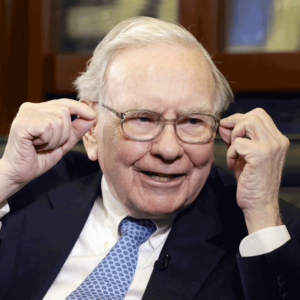
Last year saw the conclusion of a 10-year wager between Warren Buffett, chairman of Berkshire Hathaway Inc., and Ted Seides, a New York hedge fund consultant. Seides responded to a public challenge issued by Buffett in 2007 regarding the merits of hedge funds relative to low-cost passive vehicles. The two men agreed to bet $1 million on the outcome of their respective investment strategies over the 10-year period from January 1, 2008, through December 31, 2017. Buffett selected the S&P 500 Index, Seides selected five hedge funds, and the stakes were earmarked for the winner’s preferred charity. The terms were revised midway through the period by converting the sum invested in bonds to Berkshire Hathaway shares, so the final amount is reported to be in excess of $2.2 million.
The 10-year period included years of dramatic decline for the S&P 500 Index (–37.0% in 2008) as well as above-average gains (+32.4% in 2013), so there was ample opportunity for clever managers to attempt to outperform a buy-and-hold strategy through a successful timing strategy. For fans of hedge funds, however, the results were not encouraging. For the nine-year period from January 1, 2008, through December 31, 2016, the average of the five funds achieved a total return of 22.0% compared to 85.5% for the S&P 500 Index.12 (Results for 2017 have not yet been reported.)
Having fallen far behind after nine years, Seides graciously conceded defeat in mid-2017. But he pointed out in a May 2017 Bloomberg article that in the first 14 months of the bet, the S&P 500 Index declined roughly 50% while his basket of hedge funds declined less than half as much. He suggested that many investors bailed out of their S&P 500‑type strategies in 2008 and never participated in the recovery. Hedge fund participants, he argued, “stood a much better chance of staying the course.”
Seides makes a valid point—long run returns don’t matter if the strategy is abandoned along the way. And there is ample evidence that some mutual fund investors sold in late 2008 and missed out on substantial subsequent gains. But do hedge funds offer the best solution to this problem? We think educating investors about the unpredictability of capital market returns and the importance of appropriate asset allocation will likely prove more fruitful than paying fees to guess where markets are headed next. A hypothetical global diversified allocation of 60% equities and 40% fixed income13 still outperformed the hedge fund basket over the same nine years (56.6% vs. 22.0% in total returns).
Over any time period some managers will outperform index-type strategies, although most research studies find that the number is no greater than we would expect by chance. Advocates of active management often claim that this evidence does not concern them, since superior managers can be identified in advance by conducting a thorough assessment of manager skills. But this 10‑year challenge offers additional evidence that investors will most likely find such efforts fail to improve their investment experience.
Expect The Unexpected
Financial markets surprised many investors in 2017, but then again they have a long history of surprising investors. For example, from 1926–2017, the annualized return for the S&P 500 Index was 10.2%. But returns in any single year were seldom close to this figure. They fell in a range between 8% and 12% only six times in the last 92 years but experienced gains or losses greater than 20% 40 times (34 gains, six losses). Investors should appreciate that many times realized returns may be far different from expected returns.
For a number of investors, 2017 was a paradox. The harder they tried to enhance their results by paying close attention to current events, the more likely they failed to capture the rate of return the capital markets offered.
New Year’s resolution: Keep informed on current events as a responsible citizen. Let the capital markets decide where returns will be generated.
Appendix
60/40 Balanced Strategy Index Rebalanced monthly. For illustrative purposes only. The balanced strategy index is not a recommendation for an actual allocation. All performance results are based on performance of indices with model/backtested asset allocations; the performance was achieved with the benefit of hindsight; it does not represent actual investment strategies, nor does it reflect fees associated with investing. Actual results may vary significantly. The underlying Dimensional indices of the balanced strategy index have been retrospectively calculated by Dimensional Fund Advisors LP and did not exist prior to their inceptions dates. Other periods selected may have different results, including losses. Backtested index performance is hypothetical, is not actual performance and is provided for informational purposes only. Backtested performance results assume the reinvestment of dividends and capital gains. Additional information is available upon request.
Endnotes
- Lauren R. Rublin, “Stocks Could Post Limited Gains in 2017 as Yields Rise,” Barron’s, January 14, 2017.
- Inflation data © 2018 and earlier, Morningstar. All rights reserved. Underlying data provided by Ibbotson Associates via Morningstar Direct.
- As measured by the MSCI All Country World IMI Index (net dividends).
- Adam Shell, “How Will Stocks Make Out in 2017?” USA TODAY, December 24, 2016.
- S&P data © 2018 S&P Dow Jones Indices LLC, a division of S&P Global. All rights reserved.
- As measured by the MSCI Korea IMI Index (net dividends). MSCI data © MSCI 2018, all rights reserved.
- Jonathan R. Laing, “China’s Debt Addiction Could Lead to Financial Crisis,” Barron’s, November 5, 2016.
- As measured by the MSCI China IMI Index (net dividends). MSCI data © MSCI 2018, all rights reserved.
- Neal E. Boudette, “Car Sales End a 7 Year Upswing, With More Challenges Ahead,” New York Times, January 3, 2018.
- Steven Russolillo, “Yellow Flag Waves Over Auto Stocks,” Wall Street Journal, January 4, 2017.
- Ford Motor, General Motors, and Fiat Chrysler returns provided by Bloomberg Finance LP.
- Hedge fund data from Chairman’s Letter, Berkshire Hathaway Inc. 2016 annual report.
- Global diversified allocation is the Dimensional 60/40 Balanced Strategy


