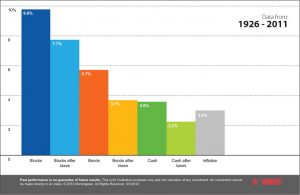
Intuitively, we know that taxes reduce returns. The chart below illustrates how much the federal government withheld from one hypothetical investor following a simple long-term investment strategy.
From 1926 to 2011, the average return on stocks after taxes was 7.7%, compared to 9.8% before taxes. Bonds averaged a 3.7% return after taxes, compared to 5.7% before taxes. After taxes, on average, bonds barely outpaced the inflation rate. Lastly, cash earned an average of 2.2% after taxes, compared to 3.6% before taxes, over this time period. Comparing the after-tax return to the rate of inflation, cash equivalents actually lost money in terms of purchasing power.
This illustration provides investors with two key insights. First, your investment allocation should reflect your ability, willingness, and need to take risk (and one risk is the loss of purchasing power). Second, for investors who have the ability, strategically placing your investments in taxable and tax-advantged portfolios can help to maximize after-tax returns
Disclaimer
Government bonds and Treasury bills are guaranteed by the full faith and credit of the United States government as to the timely payment of principal and interest, while stocks are not guaranteed and have been more volatile than the other asset classes.
About the data
Federal income tax is calculated using the historical marginal and capital gains tax rates for a single taxpayer earning $110,000 in 2010 dollars every year. This annual income is adjusted using the Consumer Price Index in order to obtain the corresponding income level for each year. Income is taxed at the appropriate federal income tax rate as it occurs. When realized, capital gains are calculated assuming the appropriate capital gains rates. The holding period for capital gains tax calculation is assumed to be five years for stocks, while government bonds are held until replaced in the index. No state income taxes are included. Stocks in this example are represented by the Standard & Poor’s 90 index from 1926 through February 1957 and the S&P 500® index thereafter, which is an unmanaged group of securities and considered to be representative of the U.S. stock market in general. Government bonds are represented by the 20-year U.S. government bond, cash by the 30-day U.S. Treasury bill, and inflation by the Consumer Price Index. An investment cannot be made directly in an index. The data assumes reinvestment of income and does not account for transaction costs.


